

Getting an AI model into production isn’t really the hard part anymore. The trouble starts after, when real users begin pushing it in little ways you never even pictured. For most teams, it is not like traditional software where everything either works or throws a clear error, then you can fix it quick.
With AI, things can fail in a quieter manner, like it quietly hallucinates, or it ‘drifts’ away from its original behavior, then answers come back oddly inconsistent yet everything still looks fine from the outside. That’s the reason AI observability has turned into a core engineering habit, not some optional add-on people remember later.
In this article you’ll find a practical playbook for assessing, watching, and then continuously tuning AI systems so that small hiccups doesn’t snowball into expensive business issues.
Building Robust Evaluation Suites and Regression Testing
Most teams still test language models the way they test traditional software. That approach kind of falls apart, because the same prompt can end up giving different responses, and those responses can change in quality, relevance too. Yeah unit tests still matter, but they cannot really measure consistency or reliability by themselves, not on their own.
A stronger approach is to build an evaluation suite around a Golden Dataset. It should include common user journeys, edge cases, and adversarial prompts that intentionally push the model into difficult situations. The objective is simple. Catch failures before users do.
Techniques such as LLM-as-a-judge and heuristic evaluations make this process practical by scoring responses against predefined quality standards. OpenAI’s evaluation guidance reflects the same thinking. It states that generative models are inherently variable, making traditional software testing alone insufficient. Instead, it suggests starting with integrations and observability to gather high-signal traces before you even think about dataset building and evaluation runs.
Evaluation should also sneak into the CI/CD pipeline. Every time you ship a model update, change a prompt, or tweak retrieval, it ought to pass baseline thresholds for accuracy and relevance, plus latency, before anything goes live. Reliability isn’t a thing you check once, then forget. It is something you measure continuously.
Also Read: How Enterprises Are Building Identity and Guardrails for AI Agents in Production
Implementing Drift Detection and Real-Time Metrics
Once a model lands in production, the whole task switches from evaluation mode to continuous monitoring, you know, keeping an eye on it all the time. The usual infrastructure numbers like CPU and memory still matter, but honestly they show very little about whether responses are actually good. Teams also need to watch token consumption, time to first token (TTFT), semantic similarity, and the latency, so they can tell if the model is getting slower, more costly, or less dependable as time goes on.
The bigger challenge is drift. Data drift happens when user behavior changes, whether through new slang, evolving search patterns, or different customer expectations. Concept drift is more subtle. It happens when the real world shifts a little, so what we assumed yesterday becomes less true, even if the model itself didn’t really change.
Google Cloud’s 2026 agent observability guidance points out the same snag, saying that agents can drift, hallucinate and even regress without telling you. That’s why observability is essential, not just nice to have, so you can understand how they behave before problems spread outward.
One practical way to catch drift early is to compare vector embedding from production inputs and outputs against the Golden Dataset. If semantic patterns begin moving outside expected ranges, the system can trigger alerts early, giving teams time to investigate before small shifts become customer-facing failures.
Designing Actionable Observability Dashboards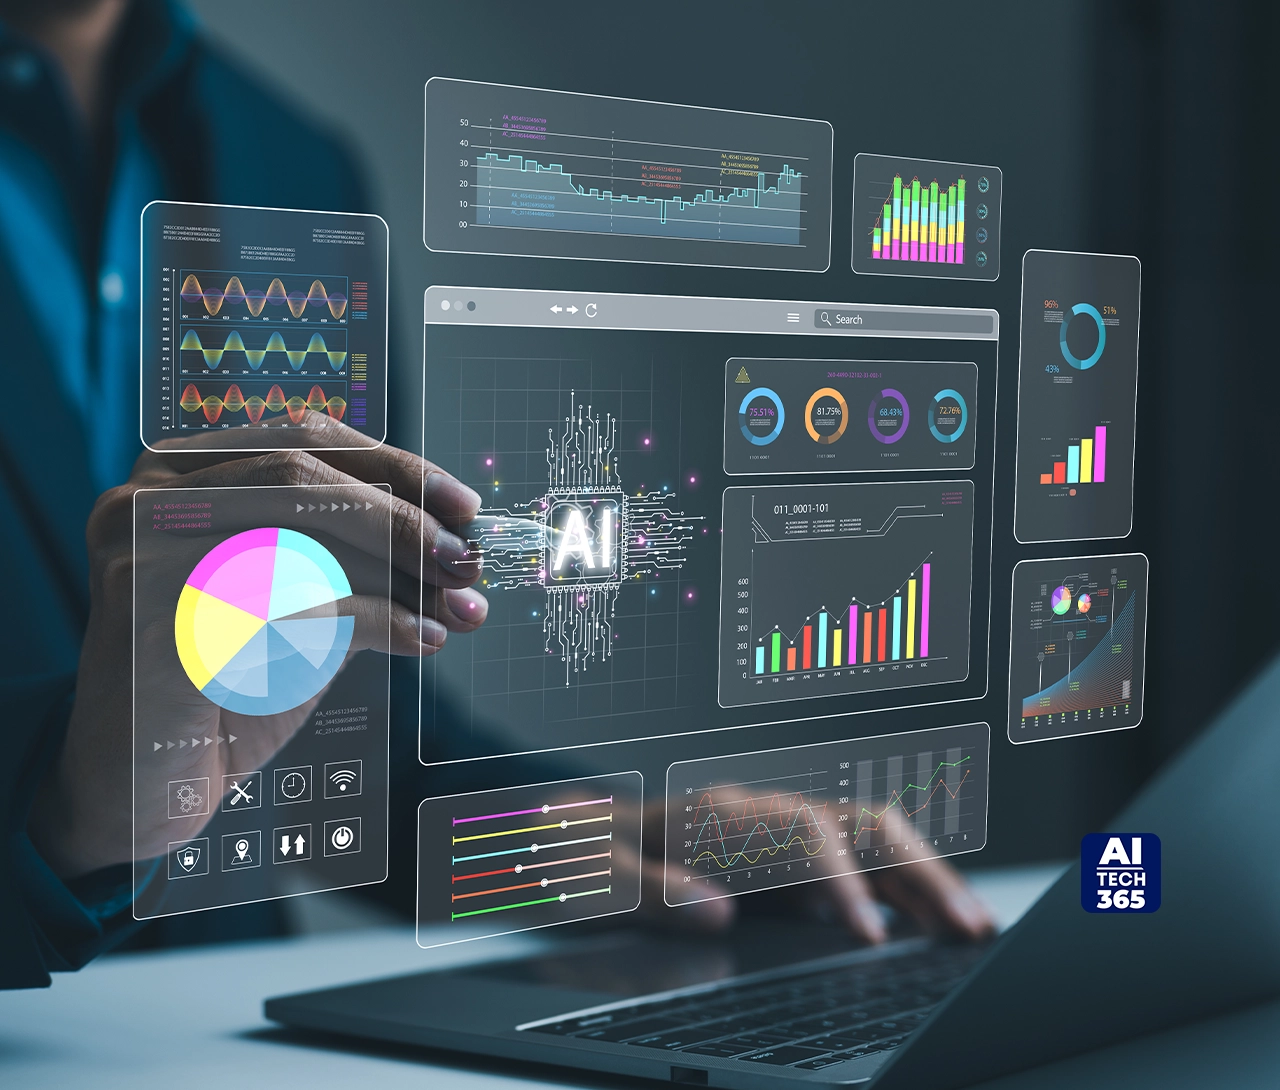
A good dashboard should answer one question quickly. What went wrong, and where? Instead of showing dozens of disconnected charts, it should connect every stage of a request into a single view.
Start with the application layer by tracking user sentiment, latency, and response quality. Then move to the orchestration layer, where prompt and response pairs, tool execution times, and multi-step workflows reveal where failures begin. Finally, monitor infrastructure metrics such as GPU utilization and API costs to keep performance and spending under control.
Microsoft 2026 Foundry observability guidance kind a frames observability as the ability to watch, comprehend, and debug systems end to end, from development through production. It also says to gather evaluation metrics, log streams, traces and even model outputs, so you can track performance, quality, safety, and operational health.
But the biggest mistake? Building dashboards that seem to yell about everything, like alerts on every little change. Instead, keep the focus on anomalies that actually matter, for example sudden spikes in token usage, weird or unusual latency, or sharp drops in semantic quality. You can use open tools like Prometheus, Grafana, Langfuse, and Arize, and get those signals into a single view, which makes issues easier to spot before users notice them.
Closing the Loop with Feedback and Incident Response
Monitoring only creates value when it leads to action. Every interaction, whether successful or not, should help improve the next version of the system. That starts with collecting both explicit and implicit feedback. Explicit signals include thumbs up, thumbs down, and user corrections. Implicit signals come from behavior such as dwell time, copy-paste rates, or whether users complete their task without trying again.
The next step is feeding those signals back into the evaluation process. Interactions flagged for low confidence, poor quality, or negative feedback should automatically flow into the Golden Dataset. OpenAI’s 2026 agent improvement loop follows a similar approach, using real traces, human and model feedback, and new evaluations to continuously strengthen future evaluation cycles.
Failures will still happen, so every production system kind of also needs an incident response plan. High-risk requests should kick in kill switches, or drop back to deterministic workflows, and if confidence falls below an acceptable threshold, then it can be handed over to a human, just like that. The goal isn’t to wipe out every failure entirely. It’s more about spotting issues early, limiting the damage, and making the same blunder less likely to repeat itself later.
Conclusion
AI observability isn’t just another dashboard to toss on the tech stack, no. It’s more like a discipline that ties together evaluation, monitoring, and continuous improvement, into one ongoing operating cycle. Without that cycle, even the best models tend to drift into unreliability, because user behavior and real-world conditions keep shifting. IBM’s April 2026 observability report noted that fewer than 1 in 10 enterprise applications are fully observable, which basically shows how much effort is still sitting out there.
And the edge won’t come from shipping models faster than everyone else. The real advantage comes from the systems, that can notice problems, learn from what happened and also get back on track when failures land. So start small, audit your CI/CD pipeline this week, then bring in your first heuristic evaluation before the next release.